Biomarker Research and Early Drug Development Gene Expression Analysis Functional Testing RealTime ready Applications
Biomarker Research and Early Drug Development Gene Expression Analysis Functional Testing RealTime ready Application

Sabine Lohmann*, Andrea Herold*, Tobias Bergauer#, Anton Belousov+, Gisela Betzl*, Manuel Dietrich*, Manuela Poignée-Heger *, David Geho', Martin Weisser+
*Roche Applied Science, Penzberg, Germany
+Roche Pharma, Penzberg, Germany
#Roche Pharma, Basel, Switzerland 'Roche Pharma, Nutley, United States
Foreword
Biomarkers and early clinical drug development anti-TWEAK complex development examples
TWEAK (a tumor necrosis factor-like cell apoptosis inducible factor) is a multifunctional cytokine that controls a variety of cellular activities including cell proliferation, migration, differentiation, apoptosis, angiogenesis, and inflammation. TWEAK acts by binding to Fn14, a highly inducible cell surface receptor that is associated with a variety of intracellular signaling pathways including the nuclear factor-kB (NF-kB) pathway (2).
Anti-TWEAK (RO5458640) is a recombinant humanized IgG1 kappa monoclonal antibody directed against TWEAK. RO5458640 binds to TWEAK, blocking TWEAK binding to the receptor. Fn14: Inhibition of TWEAK: The Fn14 signaling pathway and corresponding downstream effects promote tumor growth (3). TWEAK binds to the extracellular receptor Fn14 via the NF-κB pathway, Binding of TWEAK to Fn14 induces signal transduction. |
According to the literature search and TWEAK signal transduction pathway biological chip data, the "keyword" search function was used to complete the configuration of a RealTime ready NF-kB custom multi-well detection board in the RealTime ready configuration portal. To generate the first hypothesis, in vitro gene expression was performed in 9 different tumor cell lines (treated cell lines versus untreated cell lines, 54 samples at different time points) using the RealTime ready NF-kB panel. analysis. Based on cell line results, potential biomarkers in a mouse transplant model in vivo were confirmed using a simplified NF-kB panel (35 parameters). Based on the cell line and graft assay results, 13 potential, candidate genes were identified. In order to test the hypothesis, six parameters were selected from the above parameters, and human FFPE samples were analyzed. The above six parameters and selected reference genes are suitable for solid tumors of interest (BC, CRC, NSCLC, sarcoma, RCC). RealTime ready qPCR detection has been developed and optimization of the FFPET RNA separation function has been performed.
According to the genetic information, individualized medical care (PHC) provides health care, disease prevention and treatment services to individuals to meet individual needs. The identification and identification of biomarker molecules for specific biological status indicators plays an important role in personalized medicine (1). Therefore, biomarkers are the core elements of the drug's identification from the target to the life cycle of the drug application. Prostaglandin-specific antigen (PSA), c-reactive protein (CRP), and HER2/neu are only a few of the many biomarker molecules.
In biomarker research, there is a strong interest in mRNA expression studies in complex biological settings. RealTime ready RT-qPCR detection and RealTime ready configuration portal online to complete the selection of related marker genes, qPCR function detection helps to understand the gene expression profile. The RealCread® 480 Multiwell Plate on the LightCycler® 480 Multiwell Plate contains a user-selected, preset human, mouse or rat target sequence qPCR assay (https://configurator.realtimeready.roche.com). We have established cell lineage (in vitro), transplanted mouse models (in vivo), and gene expression analysis workflows for FFPET biomarker studies with various human studies.
Biomarker Research RealTime ready qPCR assay. Can meet different testing quality requirements. Biomarkers are important throughout the development cycle of therapeutic drug complexes (TWEAK complex development is just one example. The LightCycler® 480 real-time PCR platform is used in combination. |
Tumor cell lines (ACHN, Caki, SJSA, PANC-1, MDA-MB231, AsPC-1, SK-MES, NCI-H322M, 22RV1) were cultured under standard conditions. Cells were treated separately using TWEAK or Anti-TWEAK (RO5458640). Tumor cell lines were collected at different time points (0, 6, 24 hours) and RNA samples were stored (Qiagen).
Cellular RNA isolation
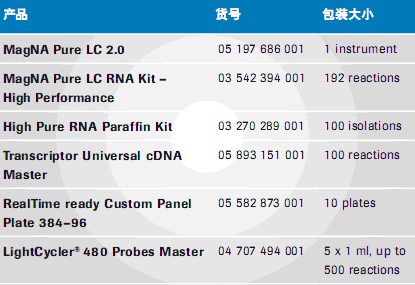
Total cellular RNA was isolated from cell pellets using the MagNA Pure LC instrument, MagNA Pure LC RNA Kit - High Perfor-mance (Roche, Cat. No. 001), and the MagNA Pure LC program "RNA HP Cells". Cell lysates were dissolved and mixed (1 x 10⁶ cells per 600 μl RLT buffer [Qiagen, Cat. No. 79216]) and 2 x 200 μl cell lysate was transferred to MagNA Pure Sample Cartridge wells (200 μl per well). The eluted lysate was repeatedly separated to prepare RNA to 50 μl, and the eluate was collected. FFPE Tissue RNA Isolation Whole Cell RNA was isolated from 10um FFPET sections using the High Pure RNA Paraffin kit (Roche, Cat. No. 03 270 289 001) according to the instruction manual (formalin fixed, paraffin-embedded tissue RNA isolation protocol) The adjusted technical procedure was as follows: 1 x proteinase K was digested for 30 minutes at 85 ° C; the second addition of proteinase K was incubated at 55 ° C for 30 minutes; and DNase was treated on a high-purity column for 15 minutes at room temperature. The adjusted technical operation steps are faster and the machine time is shorter, showing that the performance is comparable.
RNA preparation quality and quantitative analysis were performed using a NanoDrop instrument. Some sample RNA integrity analyses were performed using an Agilent Bioanalyzer and an RNA Nano chip.
cDNA synthesis
cDNA synthesis was performed using Transcriptor Universal cDNA Master (Roche, Cat. No. 001) with 1 ug of total RNA. Three separate 40 μl of reaction solution were established for each sample. The serial RNA dilutions were reverse transcribed and the concentrated product PCR was performed separately.
Real-time qPCR
1 g of total RNA 3 cDNA synthesis reaction mixture was subjected to dilution treatment and used as a template for RealTime ready Custom Panel Plate, 384 (Roche, Cat. No. 001). The preparation of the reaction mixture containing RNA was carried out using a LightCycler® 480 Probes Master (Roche, Cat. No. 001).
The overall PCR reaction volume per well was 10 μl and the final RNA capacity was 10 ng. Roche offers LightCycler® 480 software, version 1.5, and content.txt files for each instrument, making sample setup and results analysis easier.
Workflow Description: NF-κB RealTime ready Customized Multiwell Detection Plate in Vitro Study
http://?raw=true&layout=weiss&szsrc= |
For related quantitative analysis, target gene expression is normalized by reference gene expression. Ideally, standardization should be able to compensate for RNA/cDNA initiation variation and the potential inhibitors in cDNA synthesis or PCR amplification. The reference gene is used as an endogenous sample material control, and is processed in the workflow along with the target gene. In order to obtain reliable results, it is important to select the appropriate reference gene for standardization. A suitable reference gene is a relatively stable, non-expression regulatory gene in the sample of interest (4, 5). As shown in Figure 1, two genes were selected as reference genes among the four reference genes.
 Figure 1: Analysis of four reference gene expression profiles in nine cell lines. Figure 1: Analysis of four reference gene expression profiles in nine cell lines. In this study, the absolute Cq values ​​(repetitive detection) of four reference genes in 9 cell lines were plotted. PCR was carried out using the same cDNA mixture. The analysis showed that the two reference gene patterns were similar, and the reference genes were: ALAS1 (aminolevulinate, Δ-, synthetase 1) and HPRT (hypoxanthine phosphoribosyltransferase 1). The third gene: MRPL19 (mitochondrial ribosomal protein L19) is very comparable in performance, and the fourth gene: G6PDH (glucose-6-phosphate dehydrogenase) has a unique pattern. Therefore, we used ALAS1 and HPRT as reference genes for related gene expression analysis. |
In the analysis of NF-kB panel and RNA gene expression in 9 cell lines of various solid tumors, 35 differentially expressed genes were identified by standardization of Cq values ​​and a combination of two reference genes (RG). Δ Cq is calculated as follows: Cq_RG – Cq_target value, Cq_RG is the reference gene: ALAS and HPRT Cq mean. The differential expression pattern of TWEAK receptor (Fn14) in 9 cell lines is shown in Figure 2.
 Figure 2: TWEAK receptor gene expression in nine cell lines. Figure 2: TWEAK receptor gene expression in nine cell lines. The correlation ratio (log 2 scale) is calculated as follows: ΔCq = Cq_HK – Cq_Fn14. The cell line is plotted against the time point. Standardize ALAS1 and HPRT1. ACHN: Human renal cell adenocarcinoma Caki: Human renal clear cell carcinoma cell line SJSA: human osteosarcoma; multi-source sarcoma PANC-1: human pancreatic cancer; epithelioid cell line MDA-MB 231: human breast cancer model; breast; breast; pleural effusion AsPC-1: human pancreatic adenocarcinoma SK-MES-1: Human lung cancer NCI-H322M: bronchioloalveolar adenocarcinoma 22RV1: Human prostate cancer transplant cell line |
Reactivity predictive (clinical response) biomarkers can show whether an individual will optimally respond to a therapeutic complex (6). Famous examples: HER2/neu and Herceptin.
Confirmation of potential reactivity predictive biomarkers, correlation between selected 9 cell line-associated gene expression (see Figure 2) and mouse model transplant tumor growth inhibition. The cell lines collected at 1 or 24 hours were untreated cell lines and treated with anti-TWEAK for mice. The cell line gene expression results showed that the reproducibility was very high, and the treatment time or culture had no effect on the expression results. There is a high correlation between tumor growth inhibition (TGI) in mouse models and expression of potential biomarker-related genes in cell lines, as shown in Figure 3.
 Figure 3: Reactivity prediction in cell lines The correlation between biomarker 1 gene expression and tumor growth inhibition (TGI) results in vivo is high. Figure 3: Reactivity prediction in cell lines The correlation between biomarker 1 gene expression and tumor growth inhibition (TGI) results in vivo is high. RealTime ready NF-κB Customized multi-well assay plates for gene expression results and in vivo TGI mapping. Increased expression of the "biomarker 1" gene is associated with TGI. |
|
The first clinical samples we used were from various formalin-fixed, paraffin-embedded (FFPE) tissues for human studies. Tumor-derived FFPE tissue is the most relevant sample material for the development of therapeutic complexes in clinical trials or biomarker studies. RNA was extracted from FFPE tissues (eg, 10 um sections) using the High Pure RNA Paraffin kit. For revisions, see Materials and Methods.
The description of the chapter is followed by specific optimization and functional testing of RealTime ready RT-qPCR analysis.
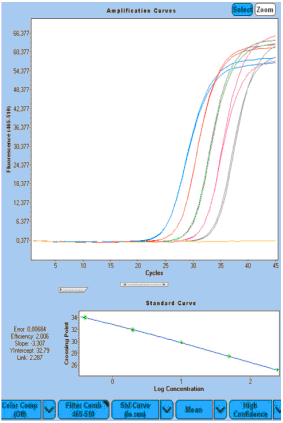
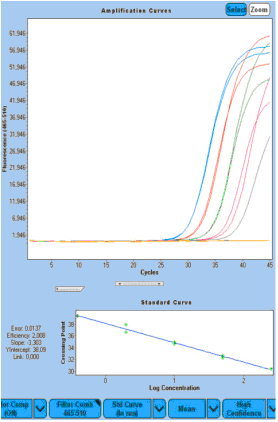
A) Biomarker 3/kidney random primer | B) Biomarker 3/FFPET BC Random Primer | C) Biomarker 3/FFPET BC specific primer |
 |  |  |
Figure 5: Potential "biomarker 3" RealTime ready qRT-PCR amplification curve. Serially diluted RNA templates from kidney RNA (A) and FFPE breast cancer (BC) samples (B and C). PCR initiation was performed using a 250 ng, minimum 0.4 ng 1:5 dilution of the PCR reaction mixture (A and B), or 100 ng, a minimum of 0.16 ng 1:5 diluted PCR reaction mixture (C). In C, specific primers are used instead of random primers for cDNA synthesis initiation to increase sensitivity. | ||

RealTime ready RT-qPCR can be successfully applied in the FFPE study sample hypothesis test
Detection. Different sample workflow scenarios have been established and described. use
High Pure RNA Paraffin kit for RNA isolation from FFPE tissue samples,
qRT-PCR analysis can be performed by RealTime ready detection.
2. Winkles, JA (2008) Nature Reviews, Drug Discovery 7(5): 411–25.
3. RDR report # 1042689 (Draft vers. April 2011)
4. Bustin, SA, et al. (2009) Clin Chem 55 (4): 611.
5. Vandesompele, J. et. al. (2002) Genome biology 3 (7)
6. de Koning, P. & Keirns, J. (2009) Biomarkers Med 3(6): 685–700.
7. Masuda, N., et al. (1999) Nucleic Acids Research 27 (22): 4436–43.

Bifidobacterium Breve,Bifidobacterium Breve Powder,Bifidobacterium Breve Probiotic,Microbiota Bifidobacterium Breve
Jiangsu Biodep Biotechnology Co. ,Ltd. , https://www.mbioda.com


 Figure 4: Anti-TWEAK treatment response versus potential biomarker 2 related gene expression ratios in an in vivo mouse transplant model. The median value of the gene expression was plotted on the log 2 scale (n = 5 animals).